General Motors Financial Performance from Time to Time
General Motors Financial Performance from Time to Time- General Motors Company (GM) is a multinational automotive manufacturing company headquartered in Detroit, Michigan, United States. Historically, it was founded on September 16th, 1908, by William C. Durant, Charles Stewart Mott, and Frederic L. Smith.
Along with the development of the business, General Motors has some vehicle brands, namely Baojun, Buick, Cadillac, Chevrolet, and Wuling. In its business, this company design, build and sell trucks, crossovers, cars, and automobile parts and provide software-enabled services and subscriptions worldwide. Totally, there are 122 Facilities and 4,232 dealers in the USA. Based on the workforce of the company, General Motors has employed around 157,000 across the globe. Most of the employees are in the USA with eighty-nine thousand employees.
The Assets, Liabilities, and Equities of General Motors
Financially, based on the financial fundamentals of General Motors, this company in 2023 has positive structures. Although this company experienced negative performance in 2008, they can manage and improve their structures. In 2023, the assets of the company are 273 billion US dollars and the liabilities of the company are 204 billion US dollars. The scars of the company happened in 2008 when the equity of the company have a negative value of – 85 billion US dollars bu in 2023, the equity was in positive conditons with value of USD 71 billion.
Based on some financial ratios (Debt to Asset Ratios and Debt to Equity Ratio) from 2008 tp 2023, most of the values showed stable performance. The average value of the Debt-to-asset ratio is 0.84. This value means that the percentage of liabilities is 84% of the Assets. Meanwhile, the debt-to-equity ratio is about 3.1. This value means that the value of liabilities is 300% or 3 times the equity.
The Revenue and Net Income of General Motors
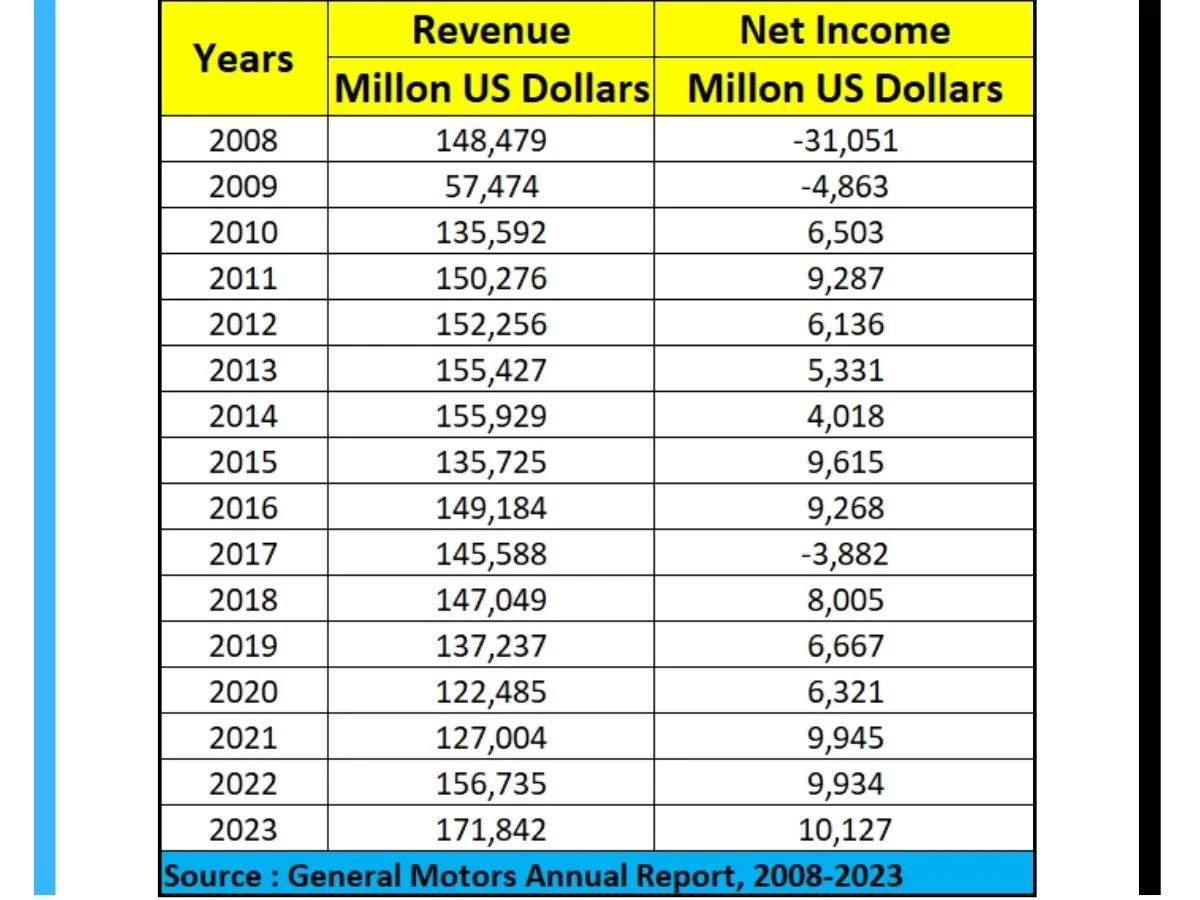
Based on the financial performance of General Motors, the company showed some negative performance in 2008, 2009, and 2017 and in the rest of these years, this company experienced a net income. In 2023, this company has a revenue of 171 billion US Dollars, with a net income of around 10.1 billion US Dollars.
In some financial ratios, the company has some value of it. The average Net Profit Margin is about 0.018. This value means that the net income is 1.8% of its revenue. In other interpretation, every one US Dollar of Revenue can become a net income of about 0.018 US dollars. Meanwhile, the average Return on Assets (ROA) and Return of Equity (ROE) are about 0.02 and 0.14, respectively. This ROA of 0.007 means that the net income of the company is around 0.7 % of its Assets. With every asset that has been used, the company can generate a net income of around 2%. Furthermore, the Return of Equity (ROE) is about 0.14. It means that the net income of the company comes from equity is 14%.
Bibliography of General Motors Financial Performance from Time to Time
Wikipedia. 2023. General Motors. Accessed via https://en.wikipedia.org/wiki/General_Motors on April 25th, 2022.
General Motors. 2024. SEC Filings. Accessed via https://investor.gm.com/sec-filings on March 25th, 2024.
Finance Yahoo. 2024. General Motors Company (GM) (Top Institutional Holders. Accessed via
https://finance.yahoo.com/quote/GM/holders/


